Medicare Insurance Statistics 2024
 Medicare Insurance Statistics 2024 are provided to help seniors make better decisions when selecting a Medicare plan option. Data shown is the most recent and accurate we are able to obtain and provide. Individuals should carefully compare all information before buying and insurance. Get everything in writing as verbal claims or information are not binding.
MEDIA AND WRITERS may use information with credit to the American Association for Medicare Supplement Insurance. Links to this webpage ( https://medicaresupp.org/medicare-insurance-statistics-2024/ ) are appreciated
For rapid access, click on the links below to jump directly to the data.
Medigap – Medicare Supplement Information
- Medicare Supplement Insurance – Policyholders – Marketshare
- How Many Seniors Have Medigap (Medicare Supplement insurance)?
- What Medicare Supplement (Medigap) Plans Do Seniors Choose (2024)
- Medigap (Medicare Supplement) Price Index – Lowest & Highest Costs (2024)
- Medigap Rate Increases – Plan G – May 2023 – April 2024
- Medigap (Medicare Supplement) Policyholder Forecast (2024 – 2032)
Medicare Advantage Information
- Half of Medicare Eligible Now Enrolled in Medicare Advantage Plans
- Medicare Advantage Enrollment Now Equals Medicare Advantage (Yearly Growth)
- Medicare Advantage Penetration – Top 10 States For Medicare Advantage Enrollment
- Medicare Advantage Plans Available – Top 10 States
- Number of Medicare Advantage Plans Average Senior Has Available
- Growth of Medicare Advantage Plans Offering Dental Benefits (2018-2024)
Miscellaneous Medicare Information for Seniors
Medigap Insurance Companies – Policyholders – Market Share (%)
| Company Name | Members (Policyholders) 2022 | Market Share % |
|---|---|---|
| United Health Group | 4,372,111 | 31.7% |
| Mutual of Omaha Group | 1,359,218 | 9.9% |
| CVS Group (Aetna) | 1,203,716 | 8.7% |
| Health Care Service Corporation | 565,706 | 4.1% |
See the list of Top-10 Medicare Supplement insurance companies (2022)
How Many Seniors Have Medicare Supplement (Medigap)
- 2022 – 13.8 Million
- 2021 – 12.5 (according to Kaiser Family Foundation) or 2 in 10 (21%) Medicare beneficiaries overall, or 41% of those in traditional Medicare.
What Medicare Supplement Plan Do Turning-65 Seniors Purchase
In 2023 seniors turning 65 (and purchasing Medicare Supplement) selected the following plans:
- Plan G – 53.2%
- Plan N – 39.5%
- High Deductible (HD) Plan G – 6.3%
- Plan F and HDF – 1.0%
See more details for the 2023 Medigap Buyer study. Access the 2022 Medicare Supplement insurance Buyer study.
Back to Top
2024 Medigap Price Index (Plan G) – Lowest and Highest Prices
| MALE Turning 65 | Lowest Premium* | Highest Premium* |
|---|---|---|
| New York, NY (Zip 10012) | $306.00 | $526.85 |
| Chicago (Zip 60601) | $114.17 | $270.76 |
| Houston (Zip 77001) | $131.81 | $279.57 |
| Phoenix (Zip 85033) | $110.14 | $458.94 |
| FEMALE Turning 65 | Lowest Premium* | Highest Premium* |
|---|---|---|
| New York, NY (Zip 10012) | $306.00 | $526.85 |
| Chicago (Zip 60601) | $116.30 | $235.04 |
| Houston (Zip 77001) | $116.67 | $254.11 |
| Phoenix (Zip 85033) | $ 99.64 | $406.51 |
See the 2024 Medicare Supplement Price Index for the top-10 metro markets. Rates do not reflect discounts (household or partner) which can range from $0 to 15%.
Back to Top
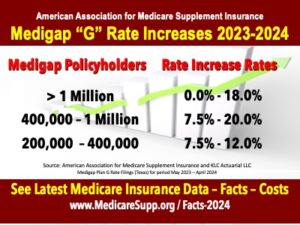
Medigap Plan G Rate Increases (2023 – 2024)
Read the full story – Medigap Rate Increases – Back to Top
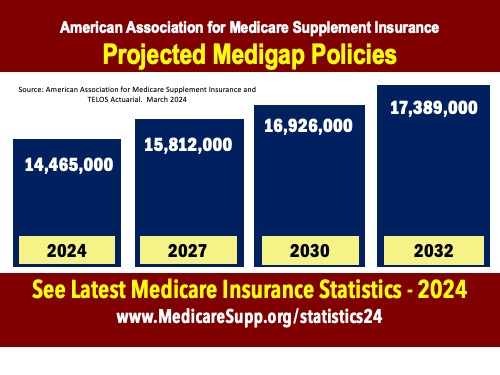
Medigap Policyholder Forecast – Number of Med Supp Policyholders 2024 – 2032
Half of Medicare Eligible Individuals Now Enrolled in Medicare Advantage Plans
33 million individuals now enrolled in Medicare Advantage plans (out of 65.9 million Medicare eligible).
2023 Market Growth +5.4% (1.7 million beneficiaries)
2022 Market Growth +9.4% (2.7 million beneficiaries)
Average senior has access to 44 Medicare Advantage plans (2023)
Medicare Advantage Plan Enrollment Now Equals Original Medicare Enrollment
| Original Medicare | Medicare Advantage | |
|---|---|---|
| 2019 | 63% | 37% |
| 2020 | 61% | 39% |
| 2021 | 58% | 42% |
| 2022 | 55% | 45% |
| 2023 | 52% | 48% |
| 2024 | 50% | 50% |
States With Highest Medicare Advantage Market Penetration (2024)
Medicare Advantage (MA) market penetration. Top 10 states.
| State | MA Penetration |
| Michigan | 61% |
| Alabama | 59% |
| Minnesota | 59% |
| Rhode Island | 59% |
| Maine | 57% |
| Wisconsin | 57% |
| Connecticut | 56% |
| Florida | 56% |
| Ohio | 55% |
| Oregon | 55% |
| North Carolina | 55% |
Number Of Medicare Advantage Plans In Each State
Medicare Advantage (MA) plans available for the top 10 states. Actual number of plans available to an individual will vary based on where they live.
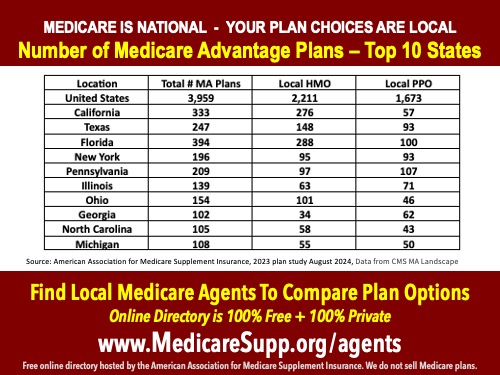
Number of Medicare Advantage Plans Available to Choose From
The typical seniors has 40 Medicare Advantage plans available to choose from in 2025

Growth of Medicare Advantage Plans Offering Dental Benefits (2018-2024)

Medicare IRMAA Surcharge – Number Paying 2024 – 2025 – 2030
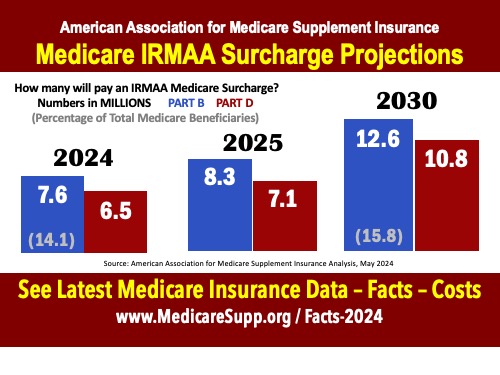
While 7.6 million will pay an IRMAA surcharge for Medicare Part B in 2024, the number is expected to grow to 12.6 million in 2030.
Medicare Insurance Statistics You Seek
If there is a particular Medicare insurance statistic that you are looking for, let us know. We’ll do our best to track it down. And, to add it to our resource page for others to view and benefit from.
The American Association for Medicare Supplement Insurance advocates for the importance of educated planning by seniors. Our support comes from independent Medicare insurance agents and brokers. We thank them for their continued support.
Links to Important Resources
Medicare insurance statistics 2022. Data and charts previously reported by the American Association for Medicare Supplement Insurance.
Access the Association’s FIND A MEDICARE BROKER NEAR ME online directory.
Find Best Part D Drug Plan Prices and options.
