Medicare Insurance Statistics 2022 - Medicare Advantage - Medigap - Data - Costs - Facts & More
What Medicare insurance statistics 2022 are you looking for? The Medicare insurance industry Association reports latest facts and data pertaining to:
- Medicare Advantage
- Medigap (Medicare Supplement)
- Prescription Drug Plans (Medicare)
- Number of plan participants
- What Turning-65 buyers select
- Costs in major markets
- Trends
- Links to key Issue Briefs
For 2024 Medicare insurance statistics, click the link.
 The American Association for Medicare Supplement Insurance conducts research we believe is important to consumers as well as insurance professionals.
Our organization does not sell insurance. We do maintain an online directory where you can find local independent Medicare insurance agents.
We report key data gleaned from respected and reputable resources. Citations are provided.
SEE THE ASSOCIATION’S MEDICARE INSURANCE INFORMATION CENTER
where we post the latest statistics and data by relevant category. With an easy-to-use SEARCH feature.
If there is specific information you would like to have please contact us.
Access 2021 Medicare insurance statistics.
Quick Links To Medicare Insurance Statistics 2022 – Click on links
MEDICARE SUPPLEMENT
MEDICARE ADVANTAGE
MEDICARE PART D – DRUG PLANS
-
- Medicare Drug Plan Enrollment – 2021
- Number of Stand-Alone Drug Plans Available By State (2022)
- Drug Plan Statistics 2022
- Average Prescriptions Medicare Drug Plan Beneficiaries
- Medicare Drug Plan Spending National Total
- Medicare Drug Plan Out-Of-Pocket Spending
- Prescription Drug Expenditures – 2018 – 2023 – 2028
Medicare Supplement Plan Enrollment (2010 – 2022)
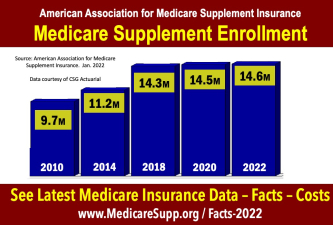 The number of individuals with Medicare Supplement (Medigap) plan coverage is expected to hold steady in 2022. A slight increase of roughly 100,000 policyholders.
Thank you CSG Actuarial for assisting with data.
Medicare Supplement Plan Choices By Turning-65 Adults (Jan-June 2022)
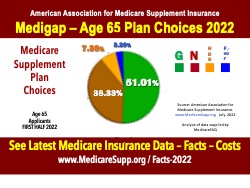
More individuals are choosing lower cost plan options like Medigap Plan N and High Deductible G. While Plan G rem,ains the most popular choice the percentage of buyers has decreased slightly compared to the 2021 data (see immediately below).
Thank you MedicareFAQ for data from over 3,000 cases.
Medicare Supplement Plan Choices By Turning-65 Adults (2021 Full Year)
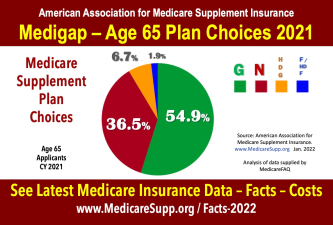 A survey of individuals age 65 who purchased Medigap in 2021. Over half (54.9%) selected Plan G.
The 2% who chose Plan F (or high deductible Plan F) were already on Medicare due to a disability and could still access Plan F.
Thank you MedicareFAQ for data from some 2,000 cases.
Medicare Advantage Enrollment – 2005 – 2020
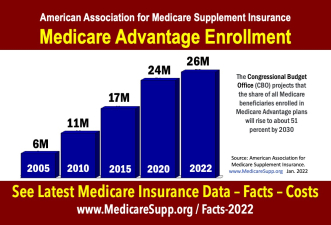 The number of Americans are in a Medicare Advantage plan increased to 26 Million in 2022. That’s roughly 42% of all Medicare enrollees.
The Congressional Budget Office predicts the share will rise to about 51% by 2030.
Medicare Advantage Enrollment By Insurer (2021)
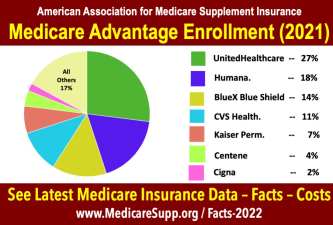 UnitedHealthcare (27%)
Humana (18%)
Blue Cross/BlueShield (14%)
CVS Health – Aetna(11%)
Kaiser Permanente (7%)
Centene (4%)
Cigna (2%)
All other insurers (17%)
Medicare Drug Plan Enrollment – 2021
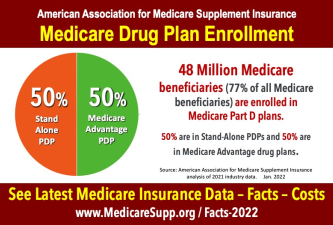 Just over three-fourths of Americans with Medicare have prescription drug plan (PDP) coverage.
Half have stand-alone coverage. And half have PDP coverage through their Medicare Advantage plan.
The average beneficiary has a choice of 50 different plans.
Medicare Drug Plan Enrollment – 2021
Just over three-fourths of Americans with Medicare have prescription drug plan (PDP) coverage.
Half have stand-alone coverage. And half have PDP coverage through their Medicare Advantage plan.
The average beneficiary has a choice of 50 different plans.
Medicare Stand Alone Drug Plan Availability By State (2022)
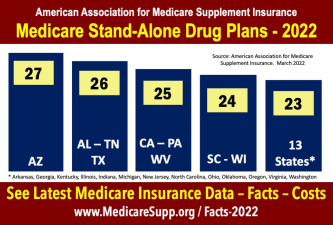
Arizona had the most Medicare stand-alone drug plans available in 2022 (27).
Alabama, Tennessee and Texas each had 26 stand-alone Medicare drug plans available.
California, Pennsylvania and West Virginia each had 25.
New York had the fewest (19). Alaska, Colorado, Louisiana and Hawaii each had 20 available plans.
Medicare Drug Plan Spending – National Totals
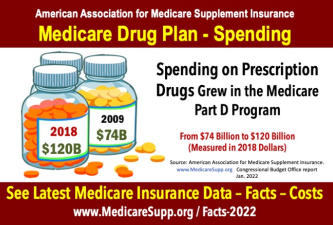 Spending on prescription drugs for the Medicare Part D program has grown according to latest data reported by the January 2022 Congressional Budget Office report.
From $74 Billion in 2009 to $120 Billion in 2018.
Through the 1980s and early 1990s, 5% to 6% of all spending on health care services and supplies was on prescription drugs obtained in the retail market ( pharmacies or by mail order). By 2018, that share was 10 percent.
Out-Of-Pocket Spending By Medicare Drug Plan Beneficiaries
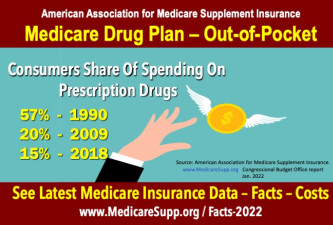
In 1990, consumers’ share of spending on prescription drugs was 57 per- cent.
By 2009, that share had fallen to 20 percent. It continued to fall thereafter, declining to 15 percent in 2018.
That long-term decline is largely explained by a gradual increase in the share of spending covered by the Medicare and Medicaid programs, which grew from 13 percent in 1990 to 36 percent in 2018. (CBO Report).
Prescription Drug Expenditures – 2018 – 2023 – 2028
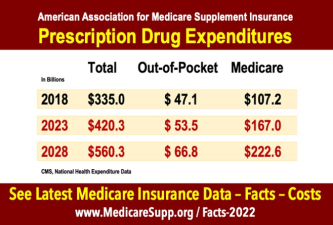 Total spending on prescription is expected to increase 67.2% (from 2018 to 2022). Data refers to all individuals (including those on Medicare).
The out-of-pocket amount that consumers will be expected to pay will increase 41.8%.
Picking the right Medicare drug plan can save seniors significant out-of-pocket costs. Find best Medicare drug plans here and save,
Learn more and find the best Medicare insurance plan options. Access the home page for the Association and search for what you need.