Medicare Insurance Data / Facts – 2020
Medicare insurance-related data compiled by the American Association for Medicare Supplement Insurance
Data and information shared here may be used with proper credit and/or acknowledgement to the American Association for Medicare Supplement Insurance. Links to our website (www.MedicareSupp.org) are appreciated. Articles (or webpages) that link to our website will be promoted by the organization.
Click on the links below to jump directly to the information.
- Medicare Advantage – 2020 Plans Available in US
- Average Number Medicare Advantage Plans Per-Beneficiary
- Medicare Supplement – 2019 Data Fact Sheet
- Medicare Supplement Insurance Sales Plans Per-Beneficiary
- Who Buys Medicare Supplement (Medigap) Insurance
- Top 20 States for Medicare Supplement (Medigap) Insurance
- Medicare Eligible Population Growth – 2020 to 2060
- Population 2020 and 2060; Race and Hispanic Origin
Medicare Advantage – 2020 Plans Available In the US
There are 100 different Medicare Advantage plans available in the United States (in 2020). Thirteen (13) plans became available for the first time in 2020. One (1) plan exited the market in 2020.
Source: Kaiser Family Foundation
Average Number Medicare Advantage Plans Per-Beneficiary
The average Medicare Advantage beneficiary had access to 28 MA plans in 2020. That is an increase from 21 (in 2018), 19 (in 2016) and 18 (in 2014).
Source: Kaiser Family Foundation
Medicare Supplement Insurance Fact Sheet – From 2019 Medigap Summit
Download a 1-page highlights of key Medicare Supplement data.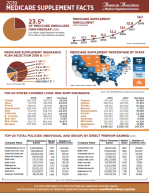
Reprinted from the 2019 Medicare Supplement Insurance industry conference program, published June 2019.
Click the image to access a PDF that you can download to your computer.
Medicare Supplement Sales
Sales of Medigap policies continue to increase year over year.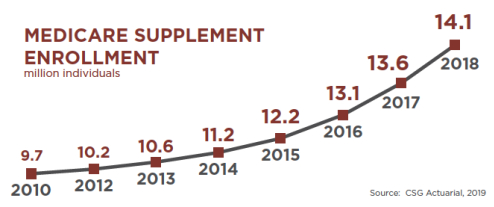
In 2018, some 14.1 million Americans owned a Medicare Supplement insurance (Medigap) policy.
That number represents an increase compared to the 9.7 million who owned a Medigap policy in 2010.
Who Buys Medicare Supplement Insurance
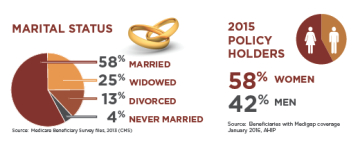
Who Buys Medigap
Most Americans who buy Medicare Supplement insurance are married and over half (58%) are women according to the most recent data.
What Medicare Supplement Insurance Plan Do People Select
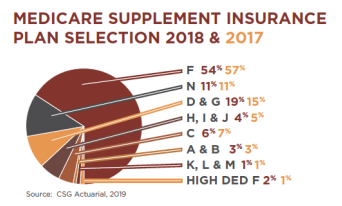
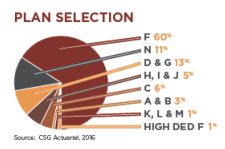
Medicare Supplement insurance plan choice
Comparison to 2016
Plan F – 60%
N – 11%
D & G – 13%
H, I, J — 5%
C – 6%
A & B – 3%
High Deductible Plan F – 1%
K, L & M – 1%
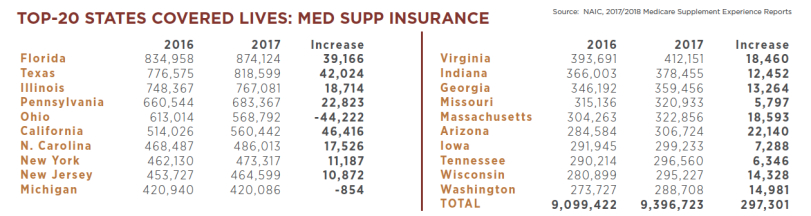
Top 20 States – Medicare Supplement Insurance
Medicare Supplement Insurance Companies
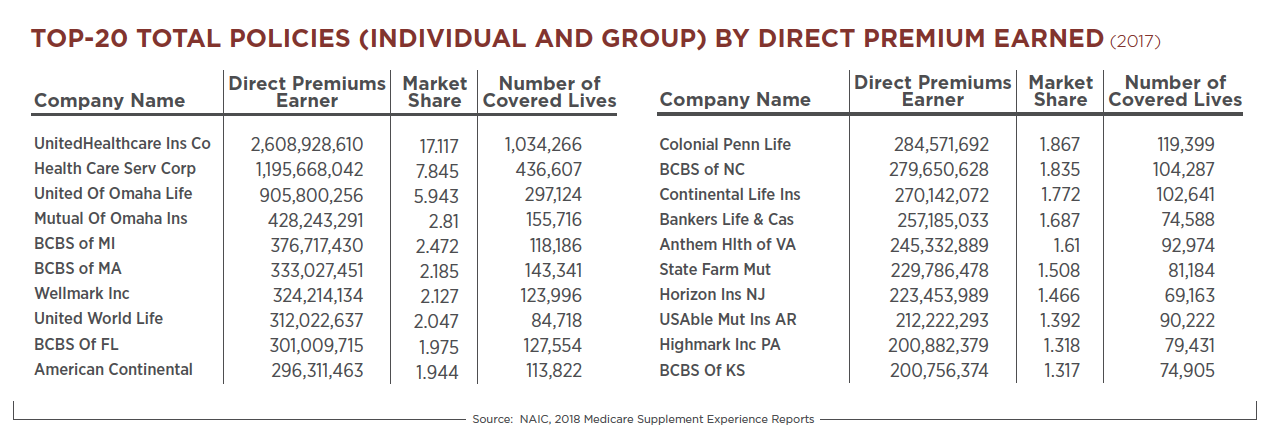
There are many Medicare Supplement Insurance companies offering coverage. Some do so on a national basis. Others are more regional in their offerings. For that reason, we strongly recommend consumers work with a knowledgeable Medicare Supplement agent who can help provide the most current information on available policies and share rates. Rates can vary significantly from one insurance company to another. But agents can’t negotiate or get you a better rate (it’s not like buying a car). For that reason, work with someone with knowledge and experience. That’s how to get the best options.
Medicare Eligible Population 2020 – 2060
 In 2018, 52 million people age 65 and over lived in the United States, accounting for 16 percent of the total population.
In 2020, around 1 in 6 Americans are age 65 and over, and this is projected to rise to 1 in 5 as soon as 2030. This not only represents a change in age composition, but a large increase in the number of older Americans, from 56 million in 2020 to 73 million in 2030. The 65 and over age group is expected to continue to increase (approaching the 100 million mark by 2060). This growth will likely slow starting around 2030 as the Baby Boomers age into the 85 and over age group.
Population 2020 – 2060; By Race and Hispanic Origin
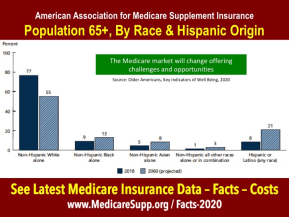 The look of the Medicare eligible population will change in the coming decades, offering challenges and opportunities. The older population is projected to become increasingly diverse, reflecting the demographic changes in the U.S. population as a whole during the last several decades. In 2018, 77 percent of the population was non-Hispanic White alone, 9 percent non-Hispanic Black alone, 5 percent non-Hispanic Asian alone, and 8 percent Hispanic (of any race). By 2060, it is projected that this will change to 55 percent non-Hispanic White alone, 13 percent non-Hispanic Black alone, 8 percent non-Hispanic Asian alone, and 21 percent Hispanic (of any race).
Although the older population is projected to increase among all racial and ethnic groups, the older Hispanic population is projected to grow the fastest.
Excellent Medicare Supplement Insurance Statistical Resources
Finding Medicare Stats, Congressional Research Service